> ## Documentation Index
> Fetch the complete documentation index at: https://docs.dentolize.com/llms.txt
> Use this file to discover all available pages before exploring further.
# Analytics overview
> The clinic's reports and charts: what each one shows, and how to filter them by date, branch and doctor.
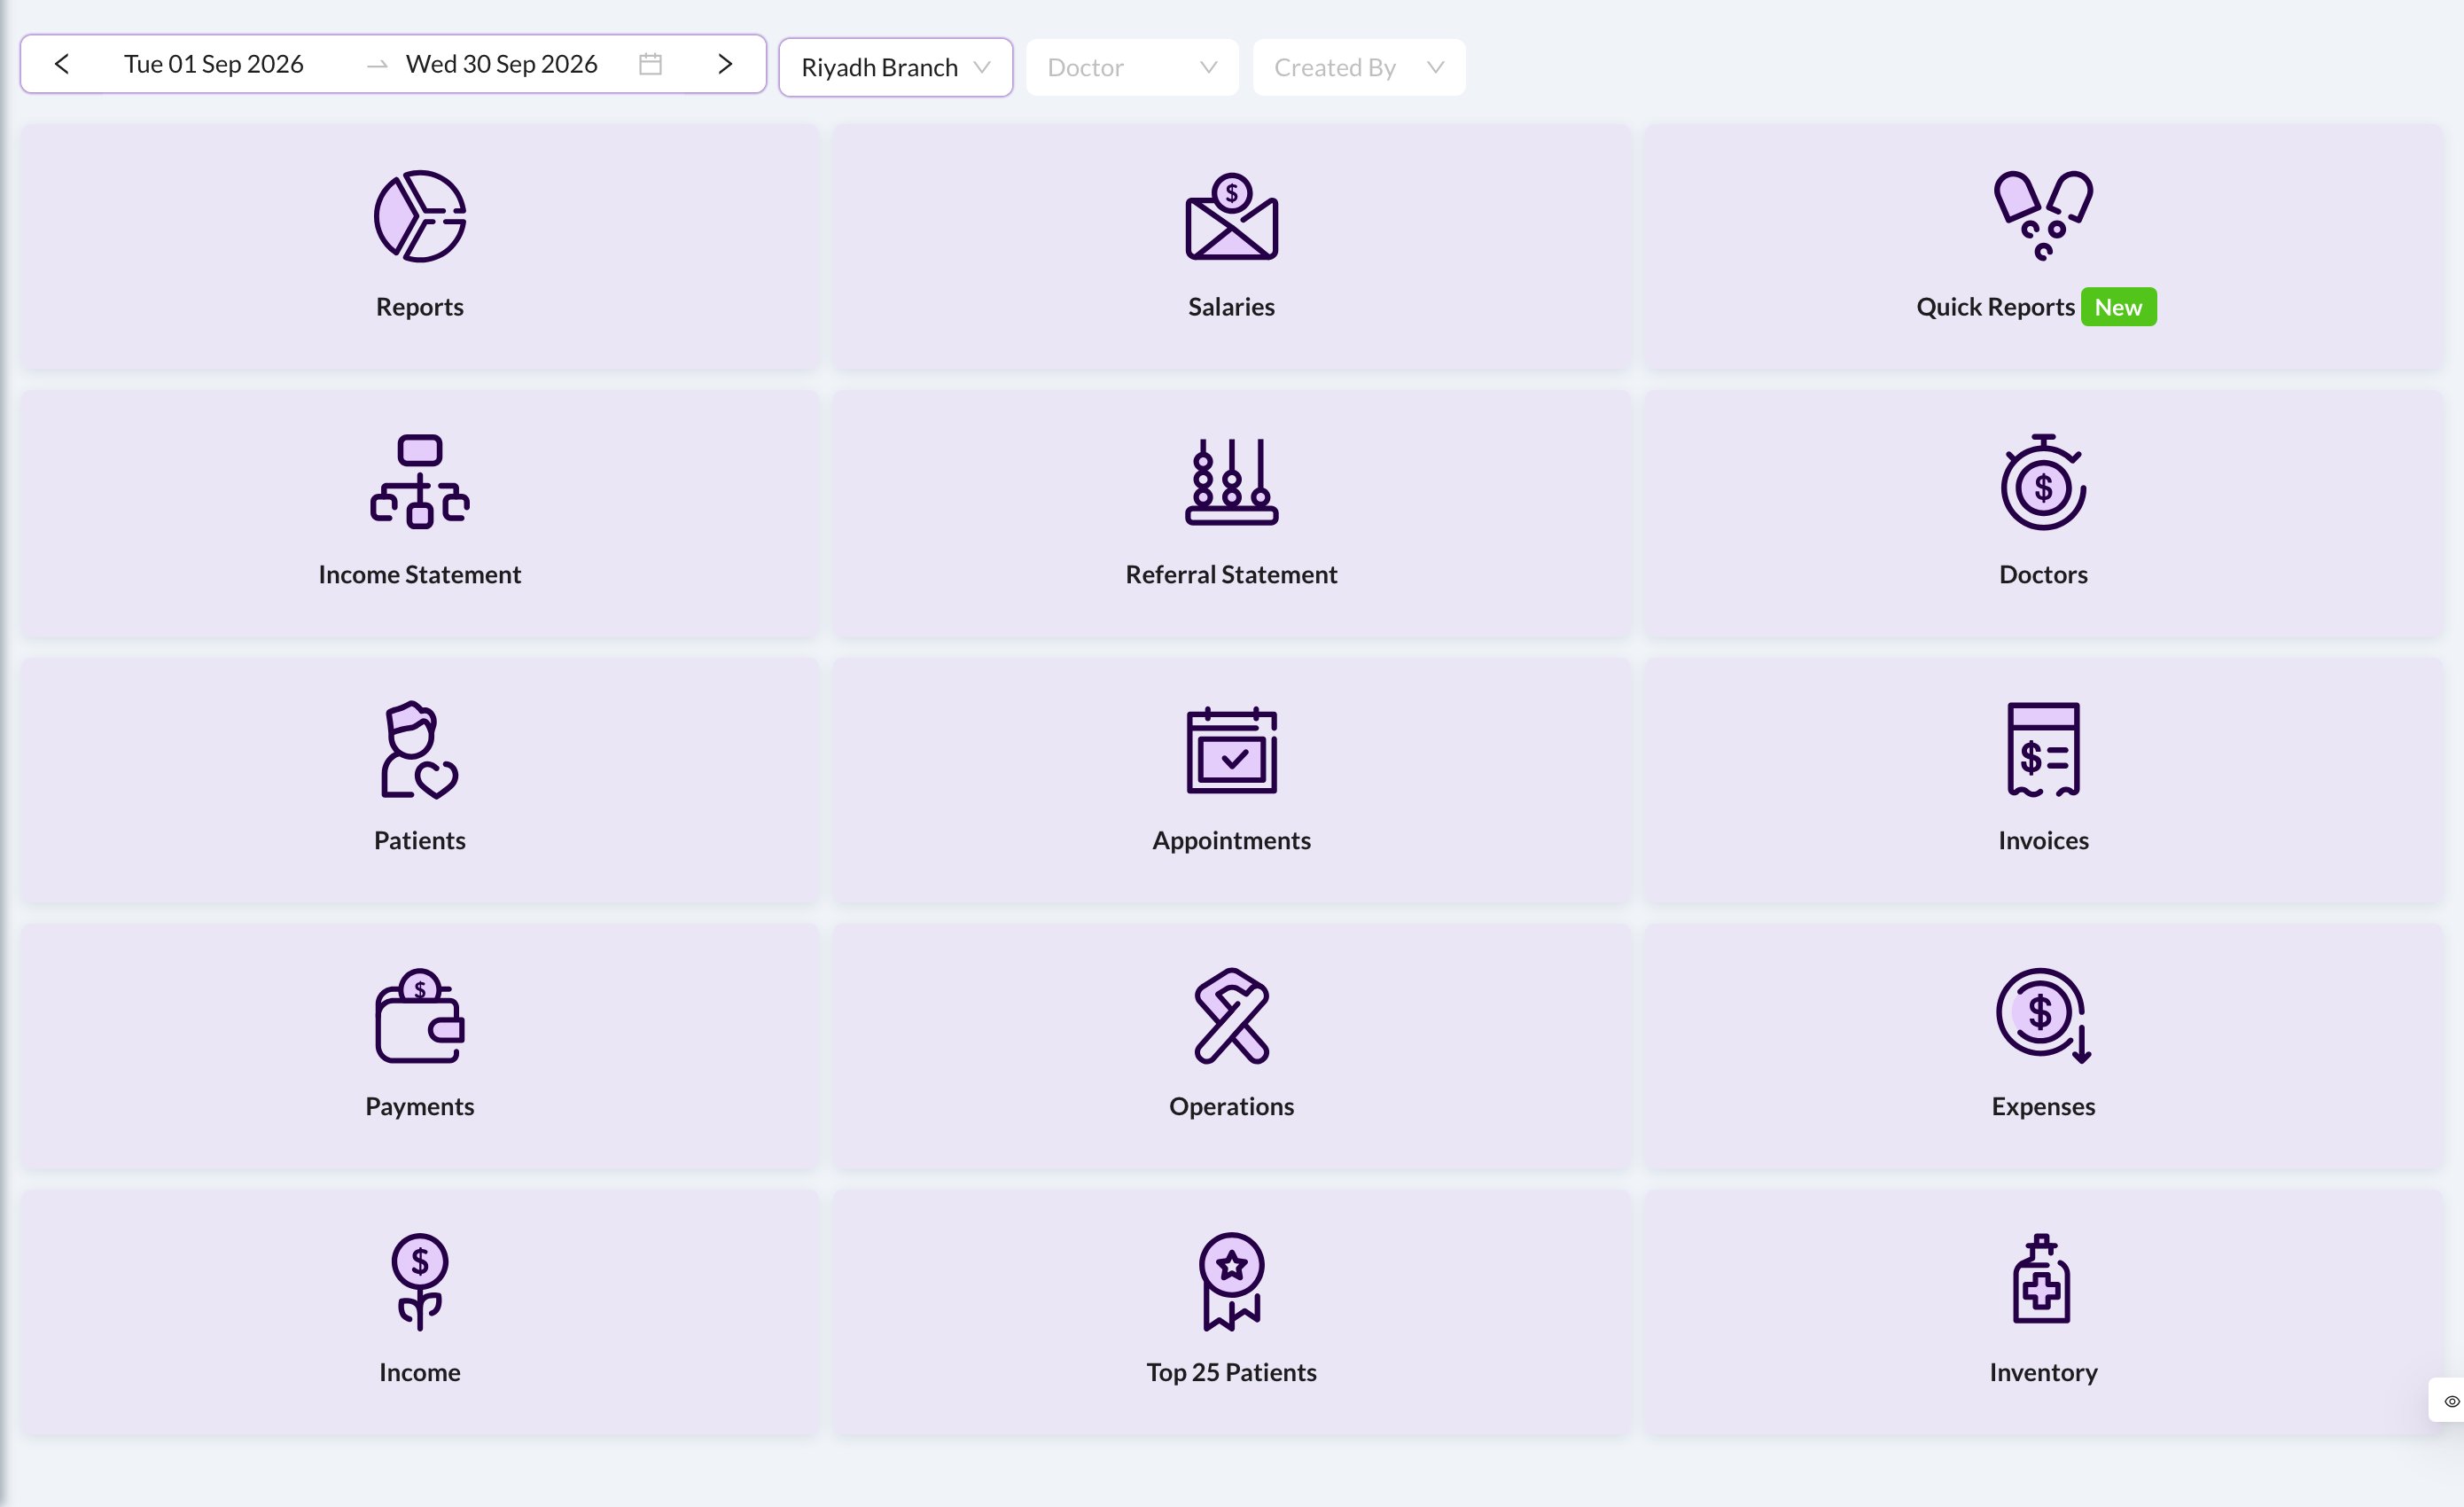
Go to **Analytics** in the side menu. Each card opens a report:
 Analytics is switched on for your clinic by Dentolize, and each report has its own permission. You only see the cards you're allowed to open.
## 🎛️ Filters
Every report has the same filter bar:
Analytics is switched on for your clinic by Dentolize, and each report has its own permission. You only see the cards you're allowed to open.
## 🎛️ Filters
Every report has the same filter bar:
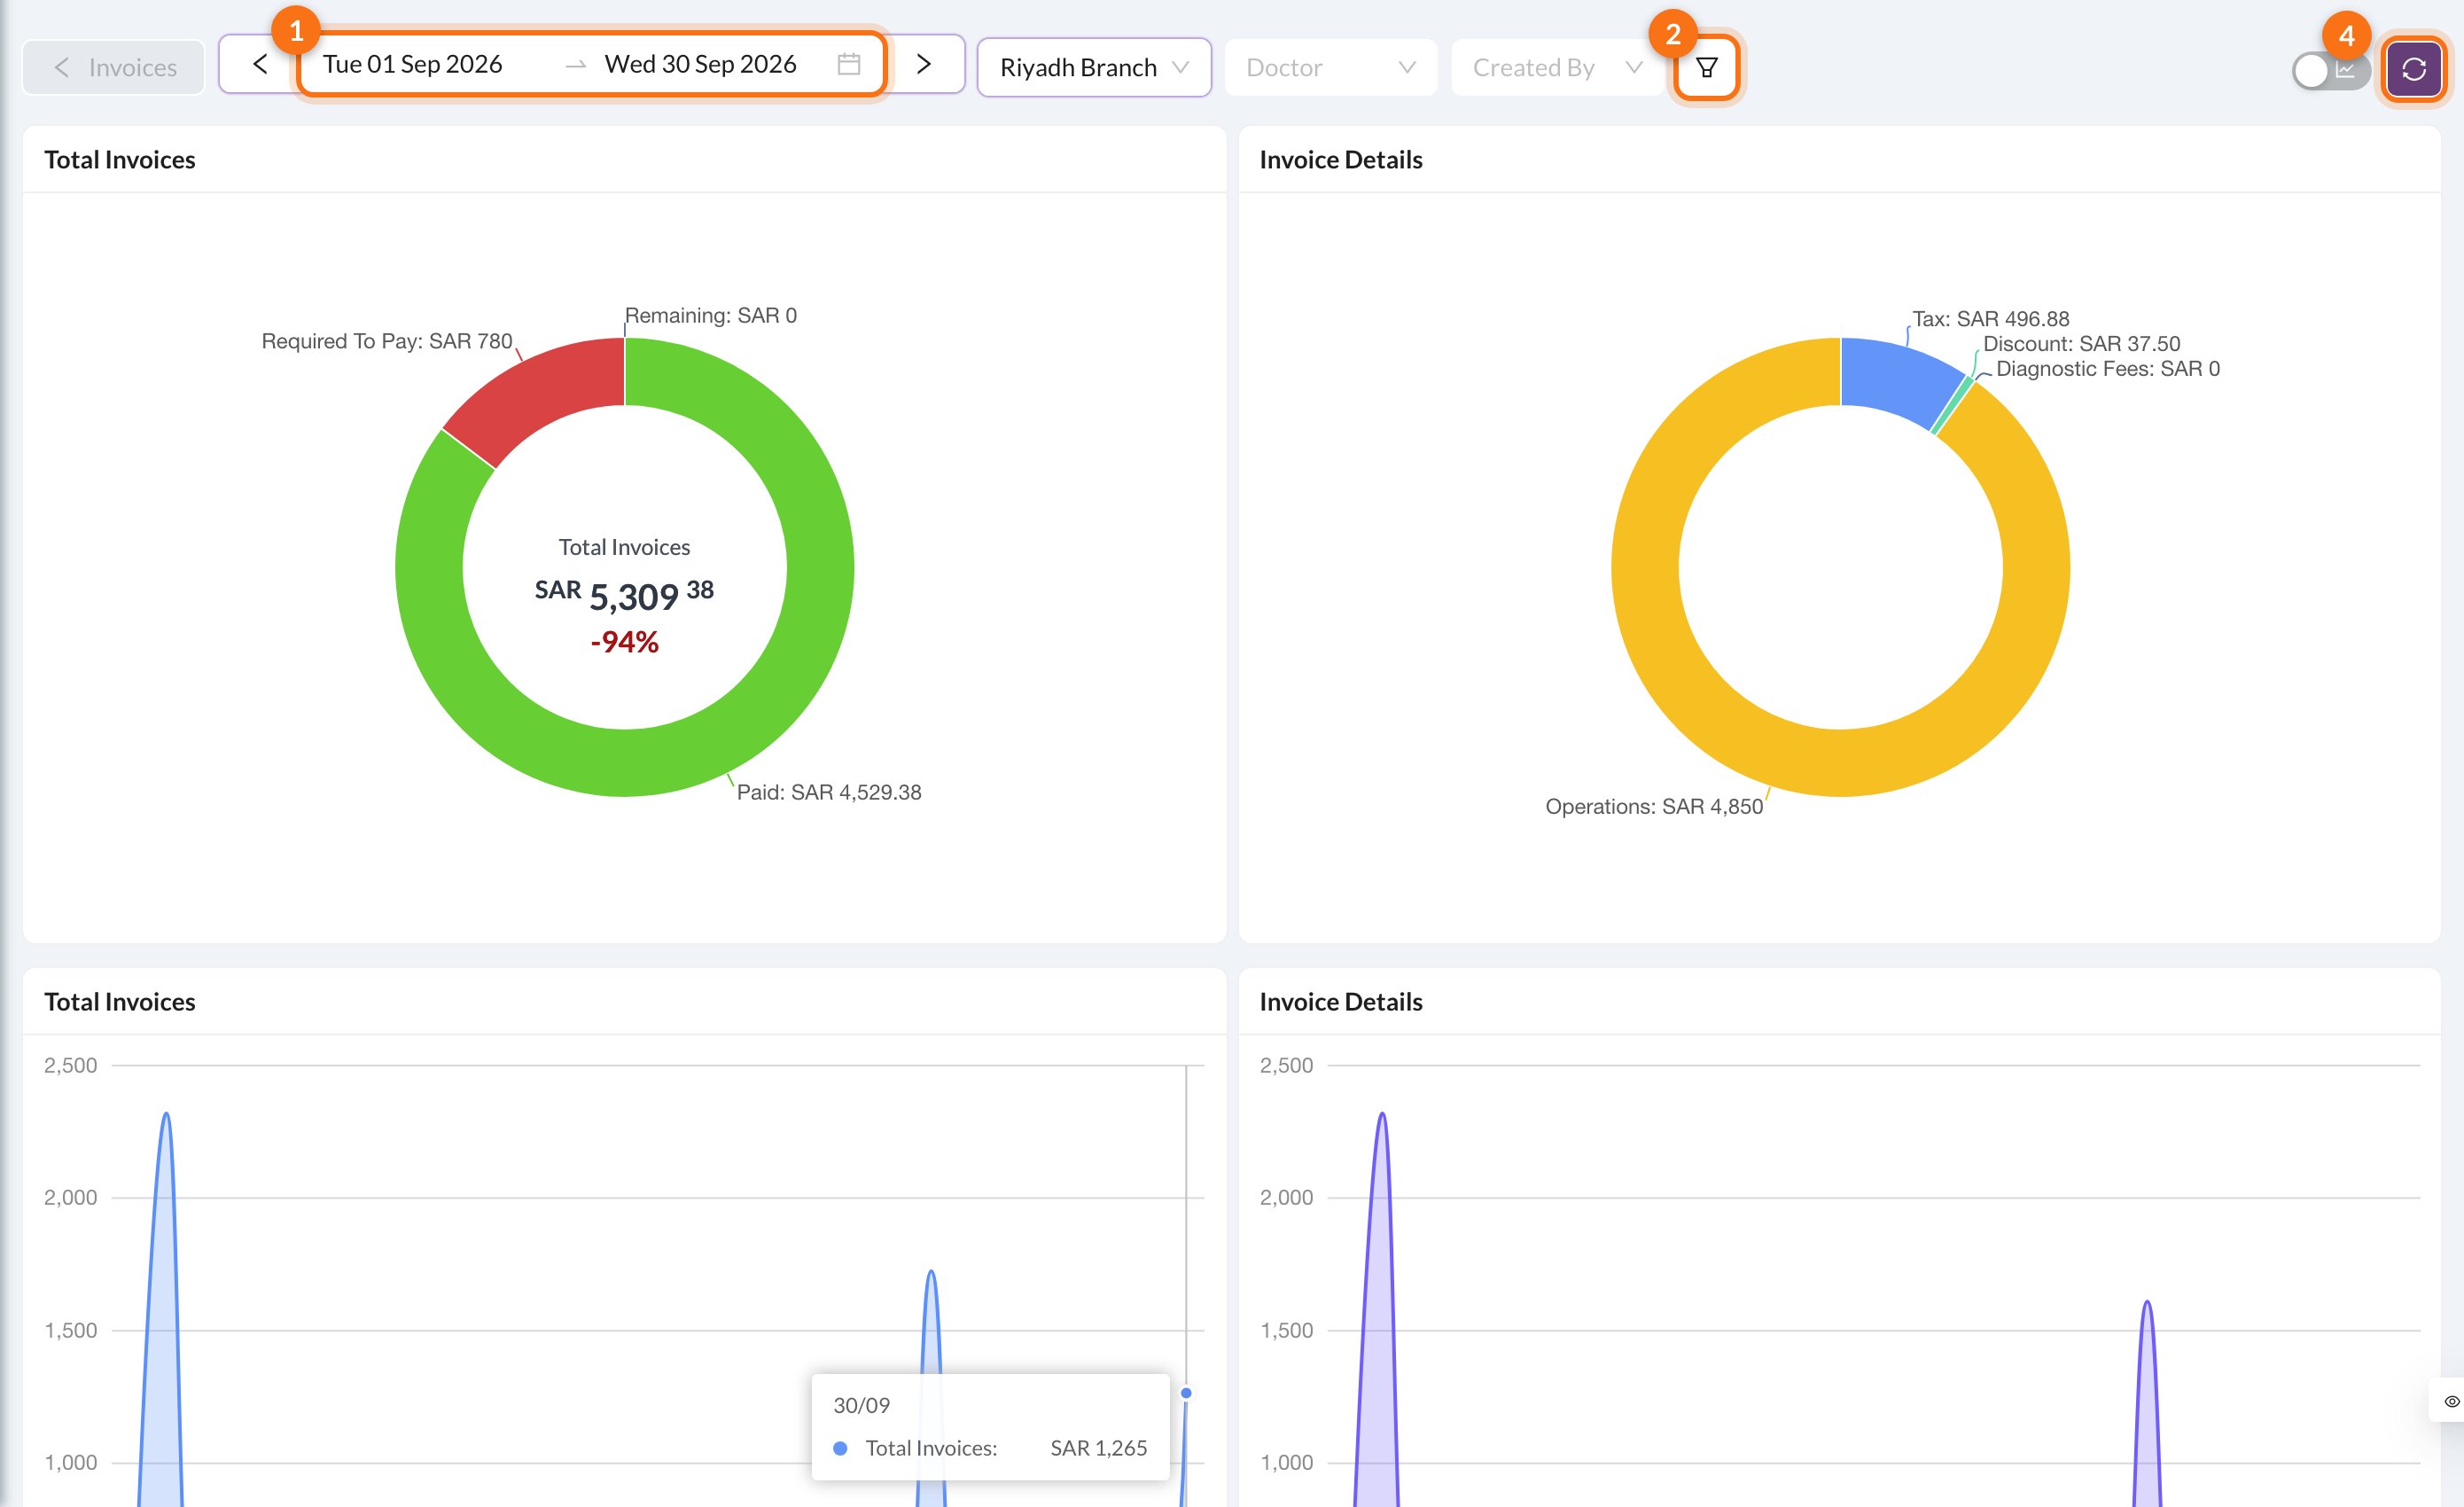 1. **Date range:** the current month by default. Use the arrows to move a period back or forward.
2. **Filters:** more filters, such as status, type, room or insurance. The badge shows how many are on.
3. **Chart / table:** switch between charts and tables.
4. **Refresh.**
You can also filter by **Branch**, **Doctor** and **Created By** (not every report uses them).
## 📊 Reports
| Report | What it shows |
| - | - |
| **Reports** | A one-page summary of the period, which you can print (see [Reports and statements](/en/analytics/reports)) |
| **Salaries** | What each user earned (see [Salaries](/en/analytics/salaries)) |
| **Quick Reports** | Ready-made lists, such as unpaid patients or leads by source |
| **Income Statement** | Revenue, costs and profit |
| **Referral Statement** | Revenue by referral source ("How did you hear about us?") |
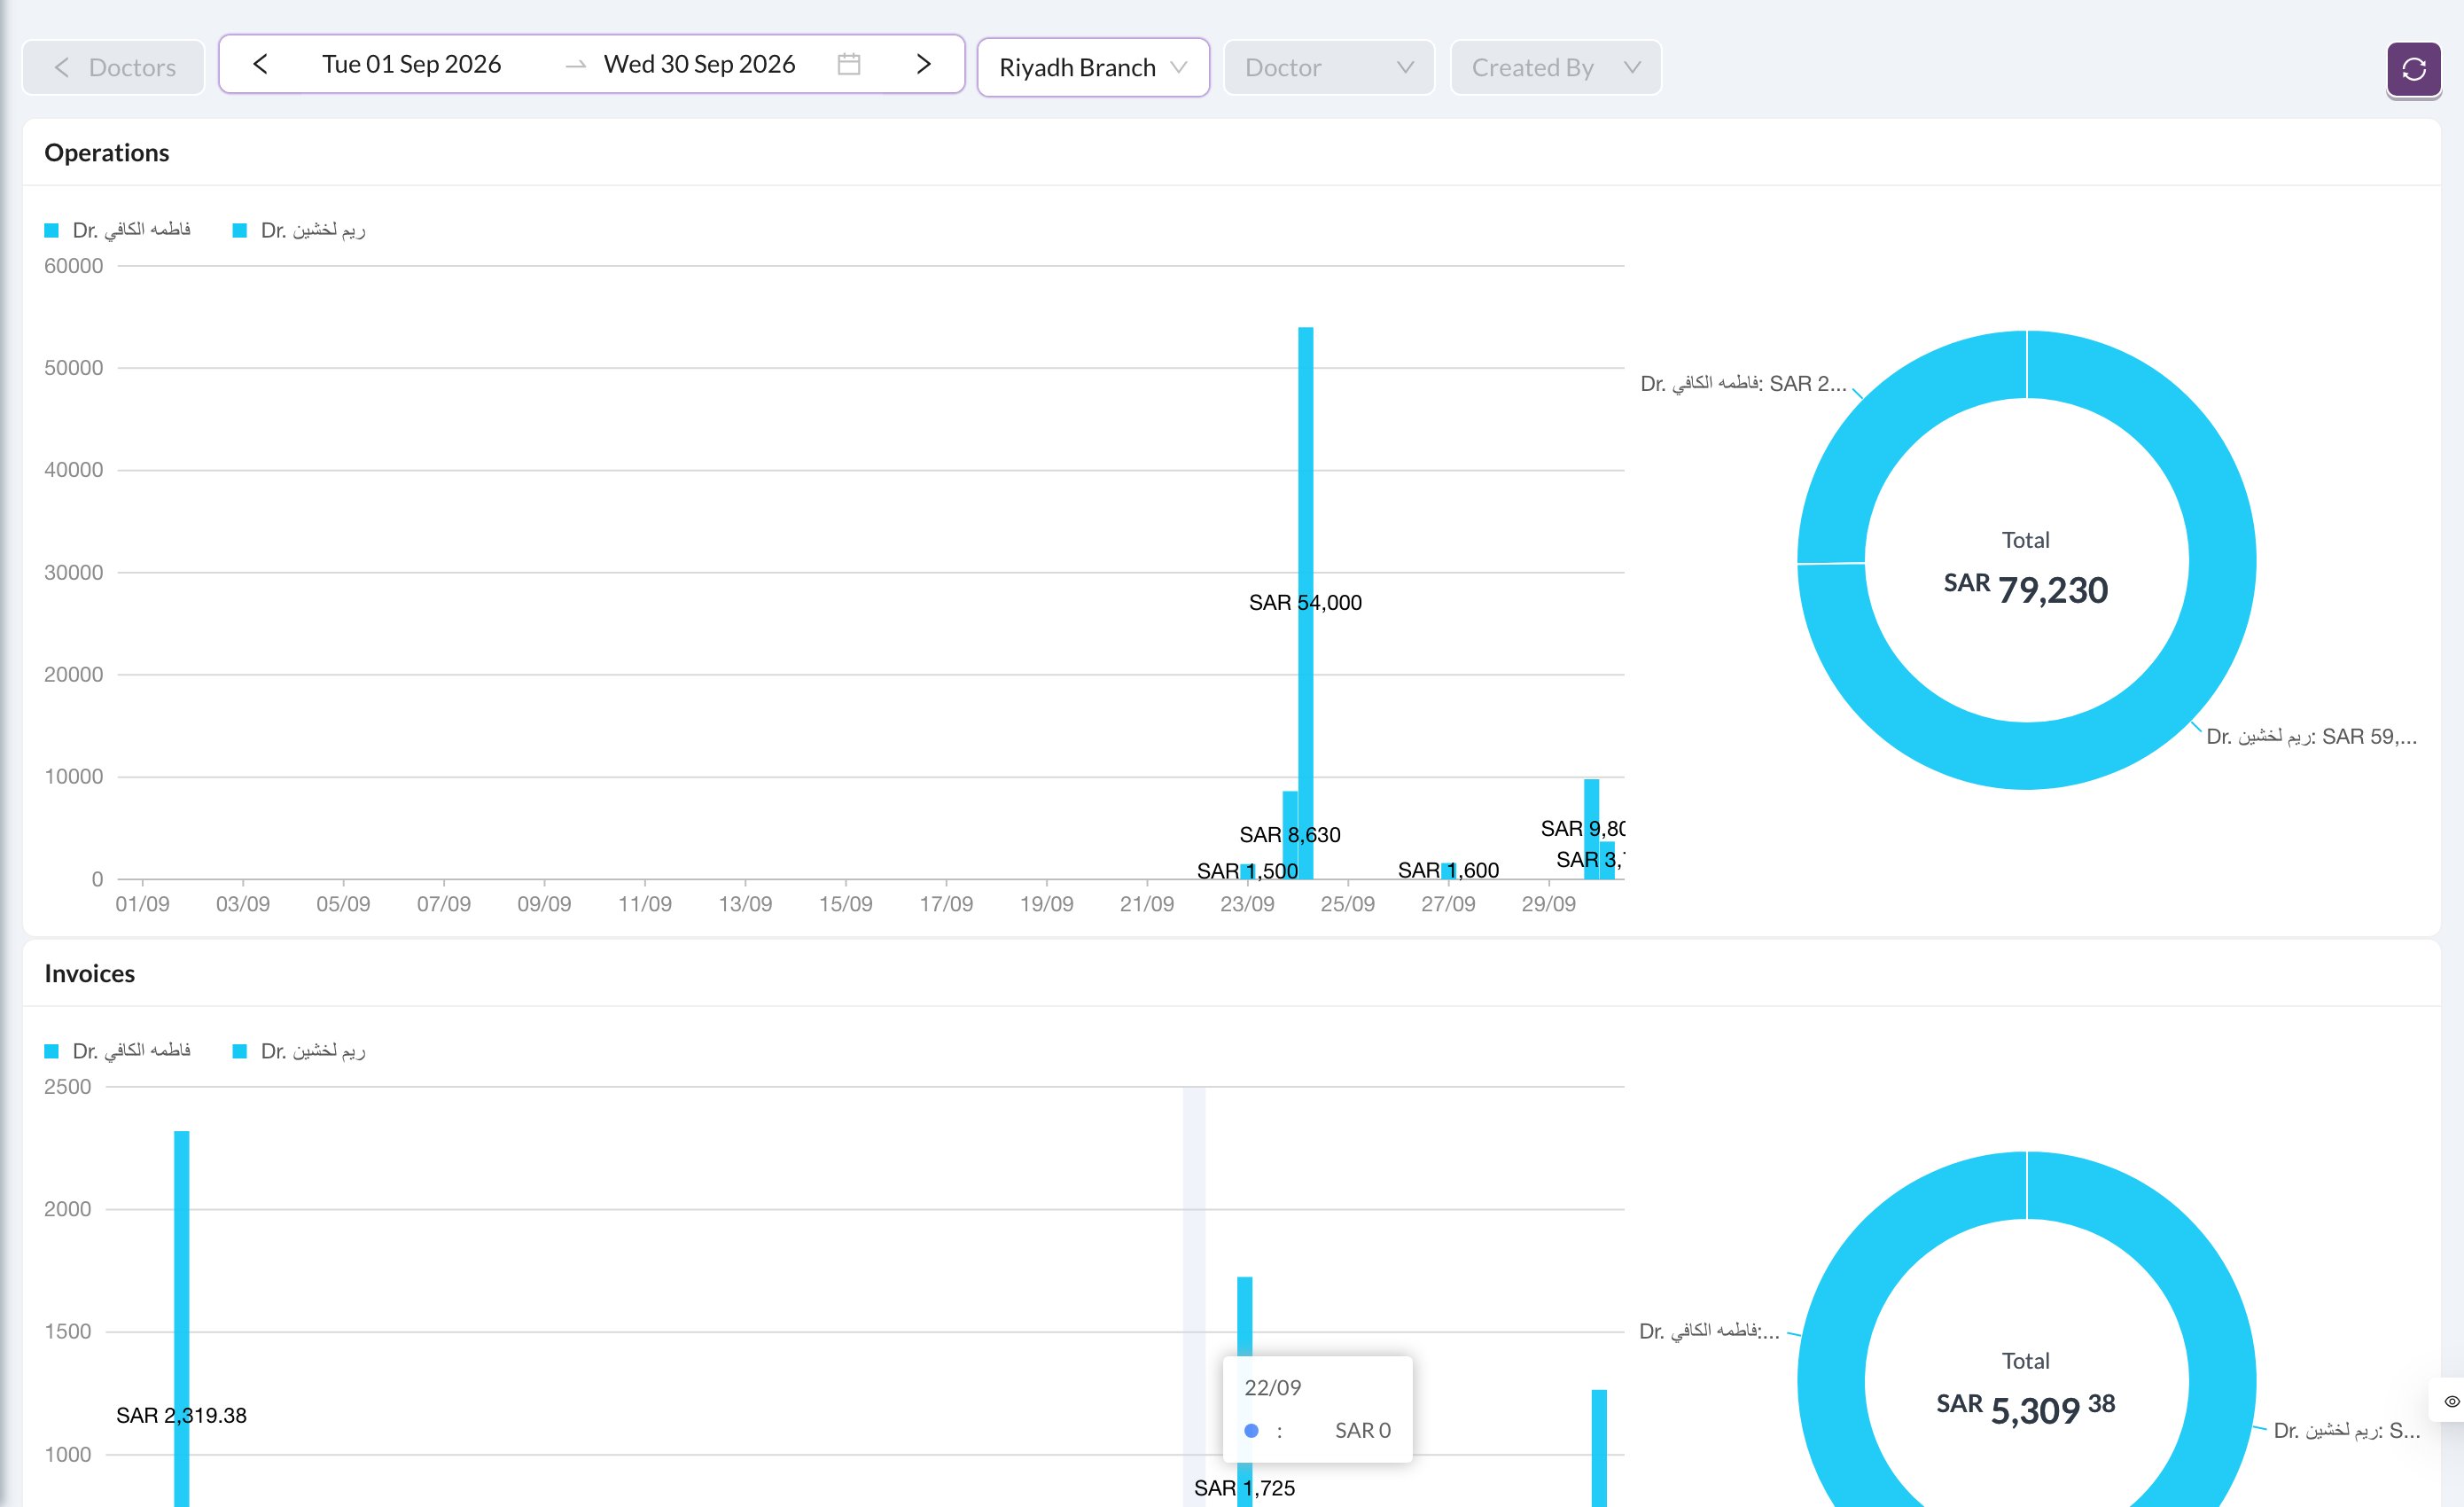
| **Doctors** | Each doctor's operations, invoices, new patients and appointments over time |
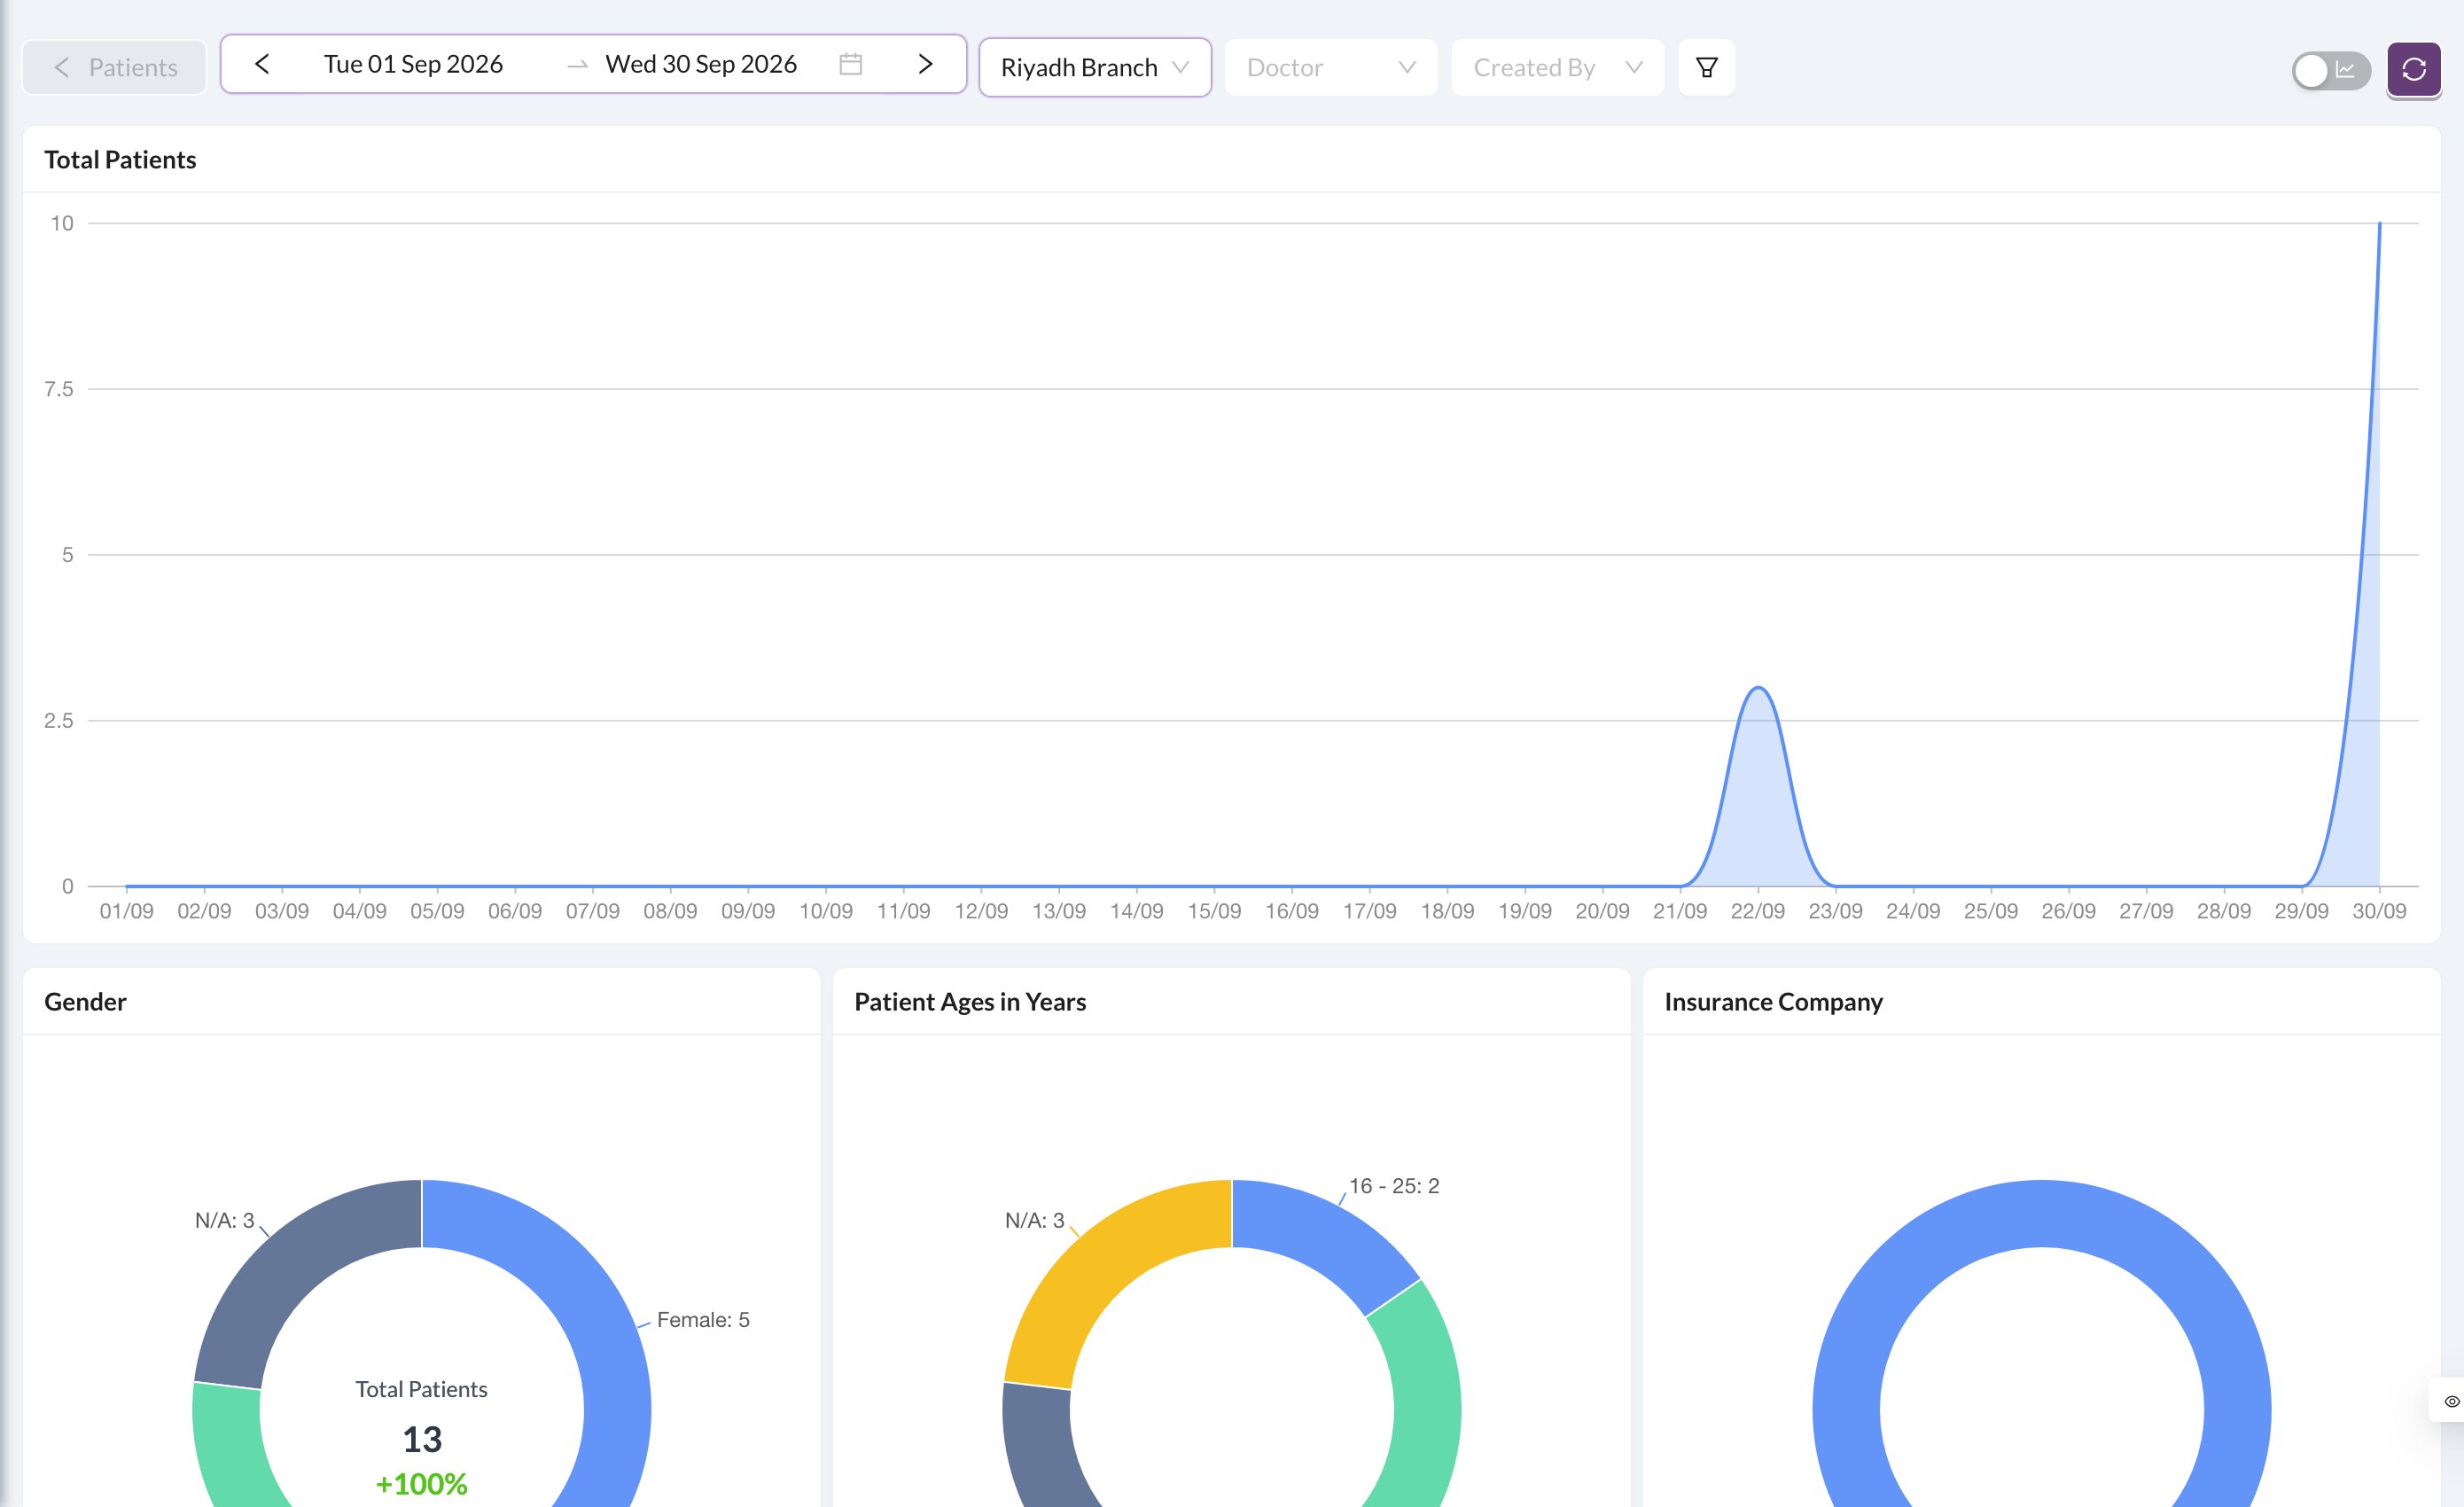
| **Patients** | New patients, gender, age, insurance company and where they live |
| **Appointments** | Appointments by status, waiting time and duration |
| **Invoices** | Invoice totals, tax, discounts, paid and remaining |
| **Payments** | Payments by type, new and returning patients, claimed and unclaimed insurance |
| **Operations** | Treatments by status and the most used procedures |
| **Expenses** / **Income** | Totals by type |
| **Top 25 Patients** | The patients with the highest invoices, payments or balances. Click one to open them |
| **Inventory** | Inventory movements, with or without prices |
1. **Date range:** the current month by default. Use the arrows to move a period back or forward.
2. **Filters:** more filters, such as status, type, room or insurance. The badge shows how many are on.
3. **Chart / table:** switch between charts and tables.
4. **Refresh.**
You can also filter by **Branch**, **Doctor** and **Created By** (not every report uses them).
## 📊 Reports
| Report | What it shows |
| - | - |
| **Reports** | A one-page summary of the period, which you can print (see [Reports and statements](/en/analytics/reports)) |
| **Salaries** | What each user earned (see [Salaries](/en/analytics/salaries)) |
| **Quick Reports** | Ready-made lists, such as unpaid patients or leads by source |
| **Income Statement** | Revenue, costs and profit |
| **Referral Statement** | Revenue by referral source ("How did you hear about us?") |
| **Doctors** | Each doctor's operations, invoices, new patients and appointments over time |
| **Patients** | New patients, gender, age, insurance company and where they live |
| **Appointments** | Appointments by status, waiting time and duration |
| **Invoices** | Invoice totals, tax, discounts, paid and remaining |
| **Payments** | Payments by type, new and returning patients, claimed and unclaimed insurance |
| **Operations** | Treatments by status and the most used procedures |
| **Expenses** / **Income** | Totals by type |
| **Top 25 Patients** | The patients with the highest invoices, payments or balances. Click one to open them |
| **Inventory** | Inventory movements, with or without prices |
 For today's numbers at a glance, use the Dashboard's **Summary** tab (see [Today's summary](/en/start/summary)).